How to Create Scatter Plots in Python Using Matplotlib
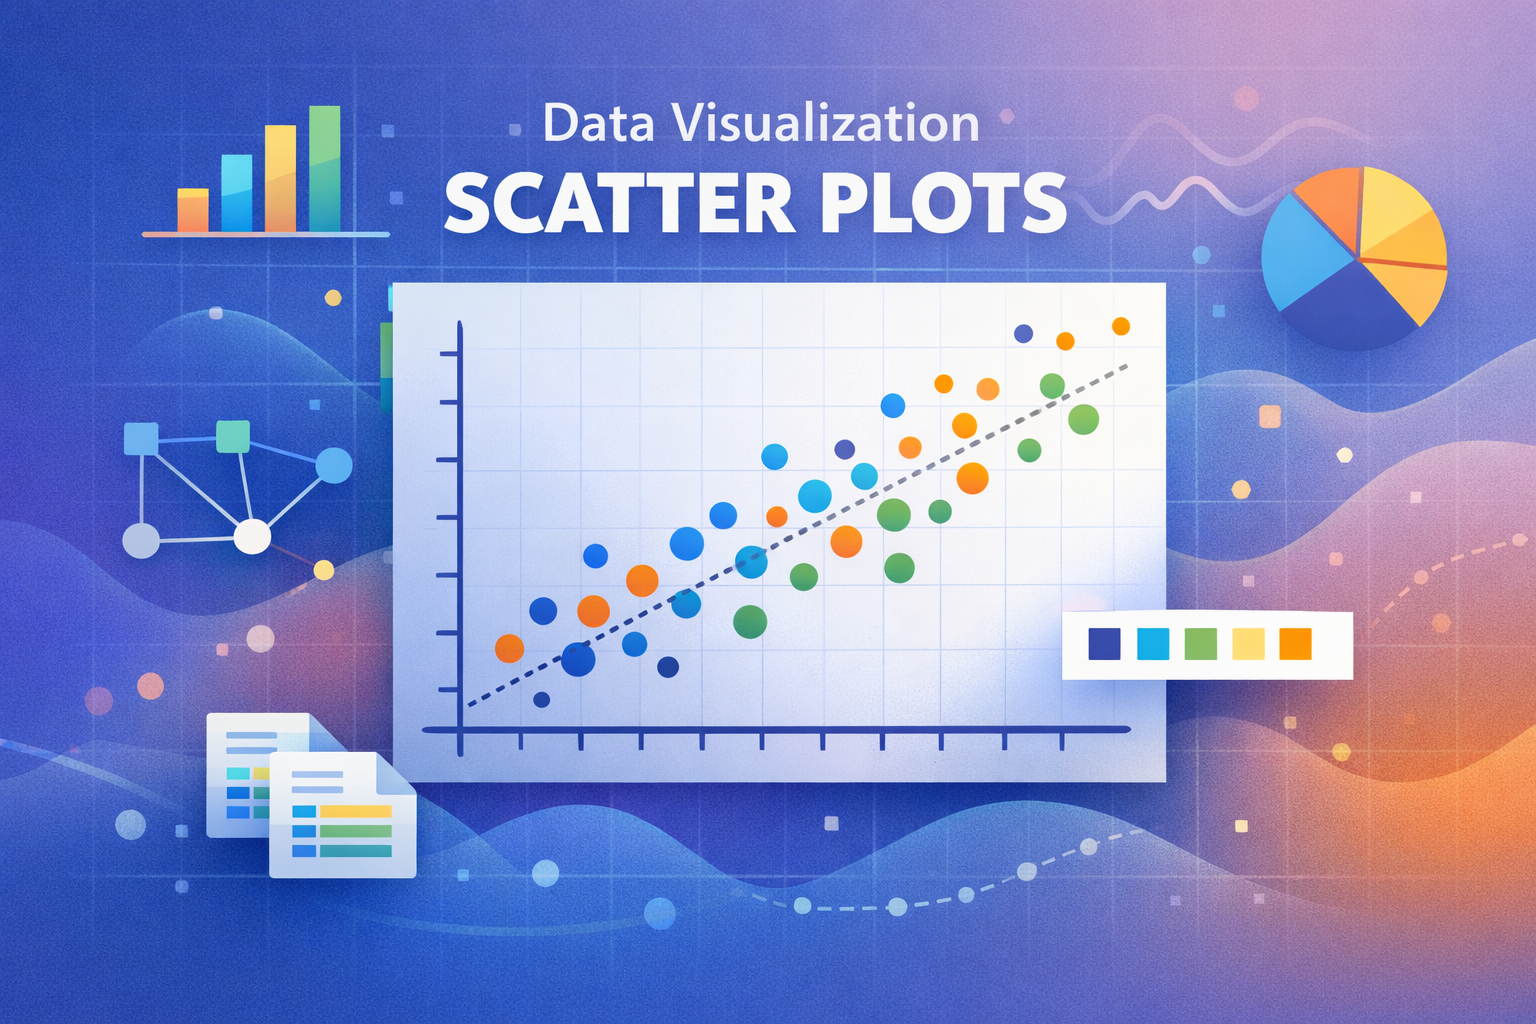
Scatter plots are one of the simplest ways to explore how two variables relate to each other. Whether you’re analysing sales data, visualizing trends, or experimenting with machine learning features, Python’s Matplotlib library gives you everything you need to build clear and customizable scatter charts.
In this guide, you’ll learn how to create scatter plots with plt.scatter(), how it differs from plt.plot(), and how to enhance your charts with color, size, shape, transparency, and colormaps.
🔹 What Is a Scatter Plot?
A scatter plot displays individual data points on a two‑dimensional plane. Each point represents a pair of values — one on the x‑axis and one on the y‑axis. This makes scatter plots ideal for spotting patterns, clusters, correlations, and outliers.
🔹 Getting Started With plt.scatter()
Matplotlib’s pyplot module provides the scatter() function, which accepts two sequences: one for x‑values and one for y‑values.
python
import matplotlib.pyplot as plt

price = [2.50, 1.23, 4.02, 3.25, 5.00, 4.40]
sales = [34, 62, 49, 22, 13, 19]

plt.scatter(price, sales)
plt.show()
This produces a basic scatter plot showing how drink prices relate to daily sales.
🔹 plt.scatter() vs plt.plot()
You can technically create a scatter plot using plt.plot() by specifying a marker:
python
plt.plot(price, sales, "o")
For simple charts, plt.plot() is often faster.
However, plt.scatter() becomes essential when you want:
Per‑point colors
Per‑point sizes
Transparency
Colormaps
More advanced customization
Think of plt.plot() as the quick option and plt.scatter() as the flexible one.
🔹 Customizing Marker Size
Scatter plots can represent more than two variables. One way to add a third dimension is by adjusting marker size.
python
plt.scatter(price, sales, s=profit_margin * 10)
Here, each point’s size reflects the profit margin of the product.
🔹 Customizing Marker Color
Colors can encode categories or numeric values. For example, you might color drinks based on sugar content:
python
plt.scatter(price, sales, c=sugar_content)
You can pass:
RGB tuples
Named colors
Numeric values mapped through a colormap
🔹 Changing Marker Shape
When plotting multiple datasets on the same chart, marker shapes help distinguish groups:
python
plt.scatter(price_orange, sales_orange)
plt.scatter(price_cereal, sales_cereal, marker="d")
Matplotlib supports dozens of marker styles, from circles to diamonds to triangles.
🔹 Adding Transparency
If points overlap, transparency makes the chart easier to read:
python
plt.scatter(price, sales, alpha=0.5)
Values range from:
1.0→ fully opaque0.0→ fully transparent
🔹 Using Colormaps
Numeric values can be mapped to colors using a colormap:
python
plt.scatter(price, sales, c=sugar_content, cmap="jet")
plt.colorbar()
Colormaps help visualize gradients, intensity, or continuous variables.
🔹 Styling Your Plots
Matplotlib includes several built‑in styles:
python
plt.style.use("seaborn-v0_8")
Styles change the overall look of your charts — colors, gridlines, fonts, and more.
🔹 Advanced Techniques: Masking Data
Scatter plots can also highlight subsets of data. For example, you can separate points that fall inside or outside a probability distribution:
python
in_region = likelihood < distribution[bus_times]
out_region = likelihood >= distribution[bus_times]

plt.scatter(bus_times[in_region], likelihood[in_region], color="green")
plt.scatter(bus_times[out_region], likelihood[out_region], color="red", marker="x")
This technique is useful for anomaly detection or segmentation.
⭐ Final Thoughts
Scatter plots are a powerful tool for exploring relationships in your data. With plt.scatter(), you can go far beyond basic two‑variable charts by encoding additional dimensions through size, color, shape, and transparency.
Once you’re comfortable with these customizations, you’ll be able to build rich, informative visualizations that communicate insights clearly and effectively.
Share this article
Loading comments...